
Areas of Expertise
Highlights of peer reviewed publications and actionable health intelligence by area of expertise. For a detailed summary of Dr. Williams’s work check out her Curriculum Vitae.
Child & Adolescent Health
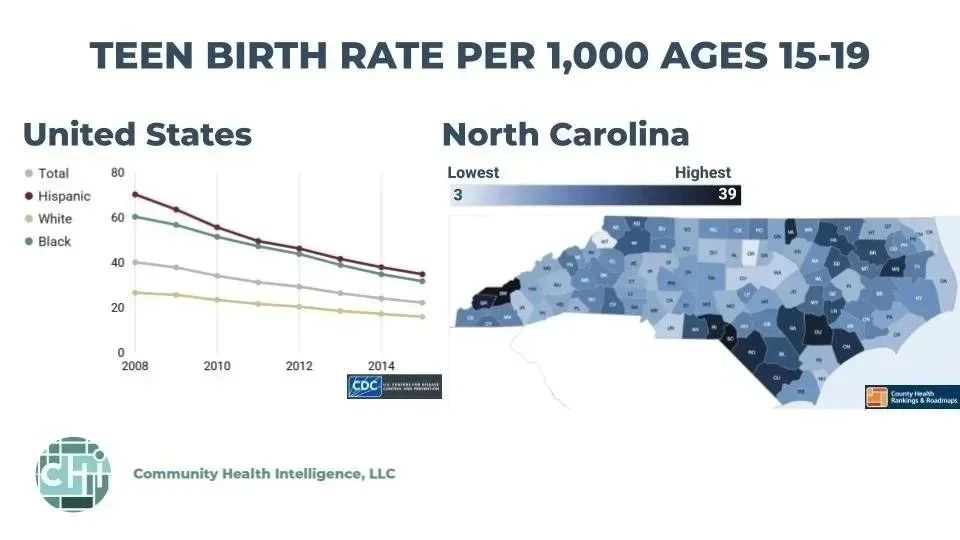
Williams Lloyd, S.C., Latimore, A., Castillo-Salgado, C., Milam, A.J., Iyer, S.D. and Leaf, P.J. (2015) The Health and Wellbeing of Children, Youth, and Families in Baltimore City: Child and Youth Mortality. Johns Hopkins Urban Health Institute.
Goldman Fraser, J. Williams Lloyd, S. C., Murphy, R.M., Crowson, M.C., Zolotor, A., Coker-Schwimmer, M., Viswanathan, M. A. (2013).Comparative effectiveness review of parenting and trauma-focused interventions for children exposed to maltreatment. Journal of Developmental and Behavioral Pediatrics, 34(5):353-68.
DeRosier, M., & WilliamsLloyd, S. W. (2011). The impact of children's social adjustment on academic outcomes. Reading & Writing Quarterly, 27(1&2), 25–47.
Community Mental Health

Williams, S.C., McMillian, M. Hepburn, A.M., and Quach, A.M. (2023) Differences in experiences, expectations, and satisfaction with police by race and ethnicity - a population-based study in two United States counties. Journal of Urban Health. 100(6):1159-1169
Williams, S.C., Davey-Rothwell, M. A., Tobin, K.E., & Latkin, C.A. (2017) People who inject drugs and have a history of mood disorder – a brief assessment of health risk behaviors. Substance Use and Misuse. 52(9): 1175-1184.
Cene, C., Akers, A. Y., Williams Lloyd, S. C, Albritton, T., Powell Hammond, W., & Corbie-Smith, G. (2011). Understanding social capital and HIV risk in rural African American communities. Journal of General Internal Medicine, 26(7), 737–44.
Economic Inequities
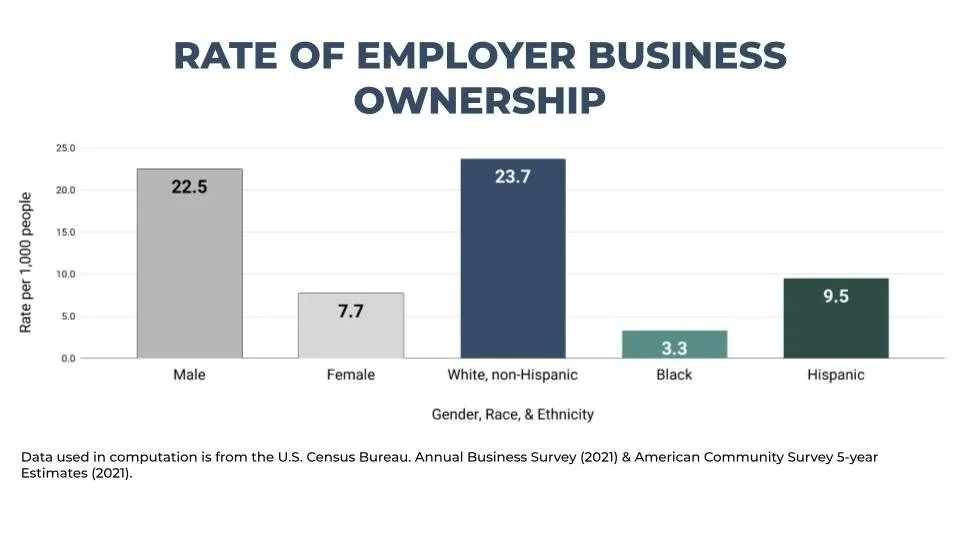
Williams, S. C. (2024) E3 Durham: Leveraging Federal Dollars to Catalyze Durham County ARPA Investment in a Small Business Support Ecosystem. Forward Cities
Forward Cities. (2021) Economic Inclusion Indicators County-level Dashboard. Tableau Public
Forward Cities. (2021) Indianapolis Entrepreneurial Ecosystem Data Pages. Tableau Public
Public Health Geography
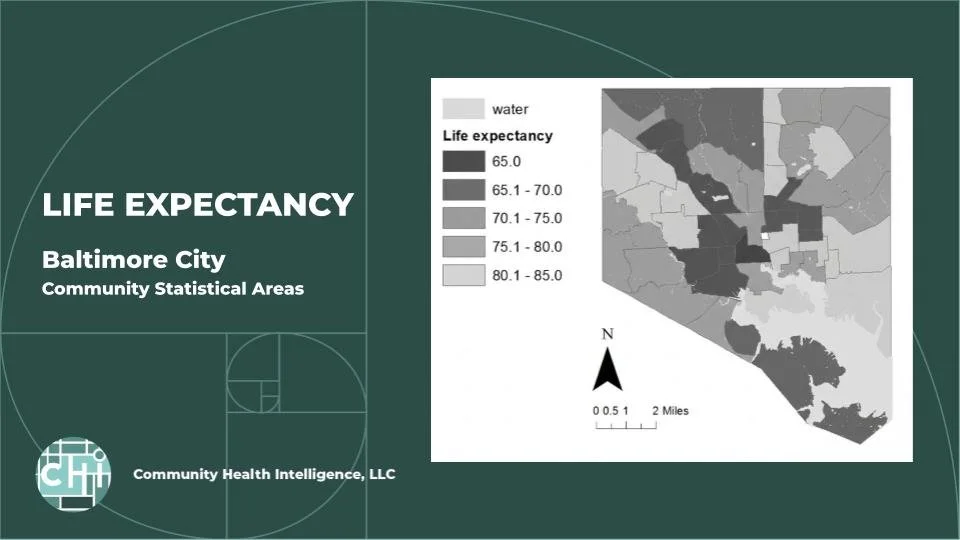
Williams, S. C., Milam, A.J., Furr-Holden, C.D.M. & Castillo-Salgado, C. (2020) Measurement of Social Processes at the Neighborhood Level in Baltimore City. American Journal of Community Psychology. 66(1-2):53-64
Williams Lloyd, S.C., Latimore, A., Castillo-Salgado, C., Milam, A.J., Iyer, S.D. and Leaf, P.J. (2015) The Health and Wellbeing of Children, Youth, and Families in Baltimore City: Child and Youth Mortality. Johns Hopkins Urban Health Institute.
Williams Lloyd, S.C., Latimore, A. , Castillo-Salgado C., Milam, A., Iyer, S., & Leaf, P. (2014). Variation in child and adolescent health across neighborhoods in Baltimore City. Invited Presentation at Urban Public Health Observatories Expert Reference Group, World Health Organization. Baltimore, MD.
Public Education

Williams, S. C., Barajas, C. B., Connolly, F., Milam, A.J., Olson, L., & Leaf, P. (2019) Preparing students for success: Differential Outcomes by Preschool Experience in Baltimore City, Maryland. Prevention Science. 21, 467-476.
Williams Lloyd, S. C., Owens Ferguson, Y., Corbie-Smith, G., Ellison, A., Blumenthal, C., Council, B., Youmans, S., Muhammad, M., Wynn, M., Adimora, A., & Akers, A. Y. (2012). The role of public schools in HIV prevention: perspectives from African Americans in the rural south. AIDS Education and Prevention, 24(1), 41-53.
Public Service Systems

Williams Lloyd, Stacey. Neighborhood Variation in the Rate Of Child Welfare Contact. Dissertation Defense, Johns Hopkins University, 2017.
Ramjohn, D.S., Nadison, M., Williams Lloyd, S. C.., Finkle, J. (2016) 2016 Community Health Needs Assessment for Mid-Atlantic States. Kaiser Permanente.
Fowler, C. I., Lloyd, S. W., Gable, J. M., Wang, J. and McClure, E. (2012). Family Planning Annual Report: 2011 National Summary. United States Department of Health and Human Services, Office of Population, Office of Family Planning.